

Model Data Set and Table Selections
Once data sources have been selected in the initial stage of modeling, the user needs to choose the data sets or tables that are usually contained within the given data source.
Usually, there are numerous tables to choose from. At a minimum, there should obviously always be one. Since each modeling requirement is different, the user needs to choose which data sets to use (green highlight below). The results will be different in most situations. For example:
- For files like Excel, the data set is either the worksheets or defined data ranges (many per source)
- For text files, its usually the file itself (1 data set per text source)
- For databases like Access, SQL Server or Oracle its usually the various database tables and views (many per source)
- For web sources like SalesForce it is also various tables (many), while for twitter is just the single search feed (1 data set).
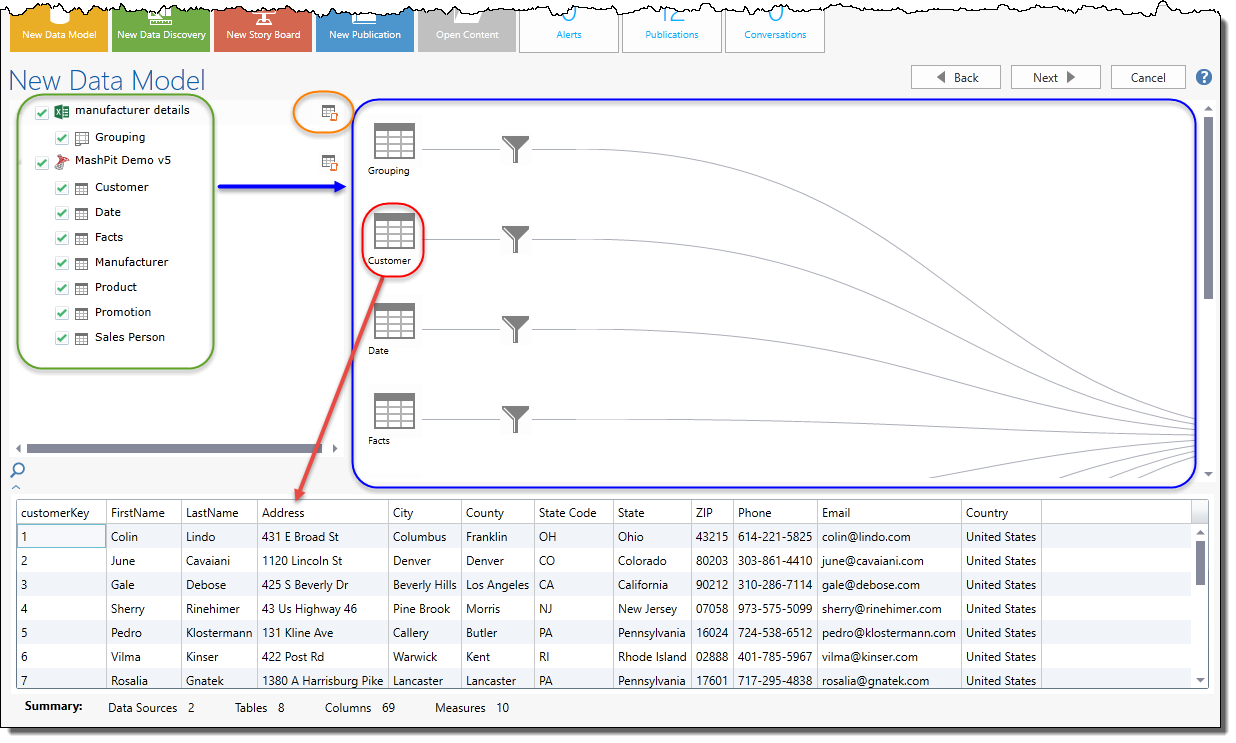
Selecting Model Data Sets
To select a data set, simply check the box (green highlight below).
- The table will appear in the flow diagram on the right (blue highlight)
- Clicking on the data set/table icon in the flow diagram, (red highlight) will expose a sample of its content in the bottom section (red arrow)
- To add a custom query script click the script button (orange highlight). Custom scripts are not always available for all data sources. Click here for more.
Using the Data Flow Diagram
Apart from giving the user a diagrammatic perspective of the data loading process, the data flow tool exposes to functions: data filtering and refresh scheduling.
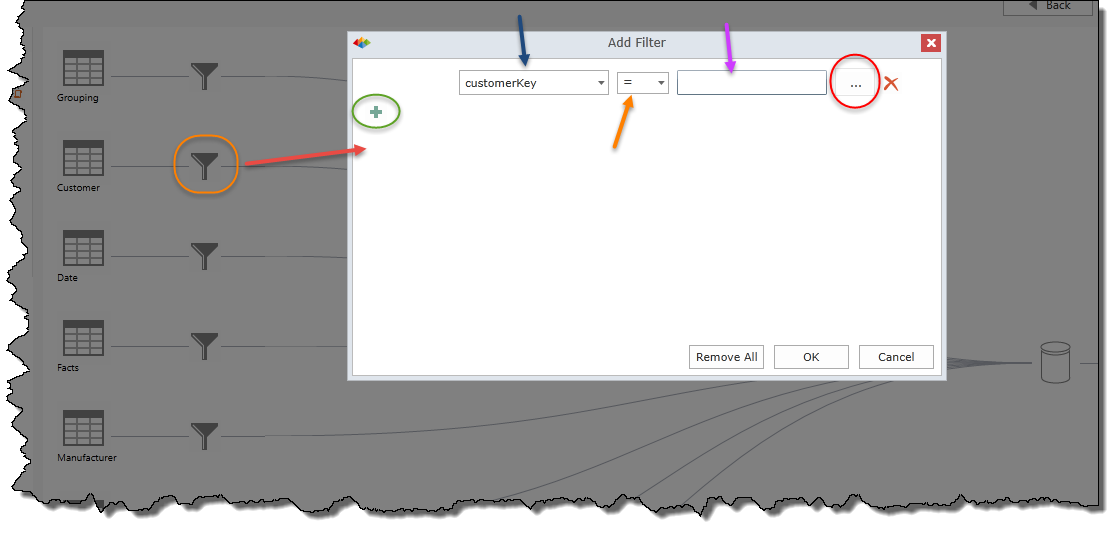
Data Filtering
Clicking the filter icon per data set (orange highlight below), the user is prompted with a dialog to set filters PER DATA SET.
- To set a filter for a particular column in the data set:
- Choose the column (blue arrow) and set its comparison operator (orange arrow)
- Set the value for comparison (purple arrow) or click the value lookup button (red highlight) to scan the column and find existing values for the column.
- To add more than 1 condition for the filter click the plus button (green highlight). To remove a condition, click the delete button on the far right.
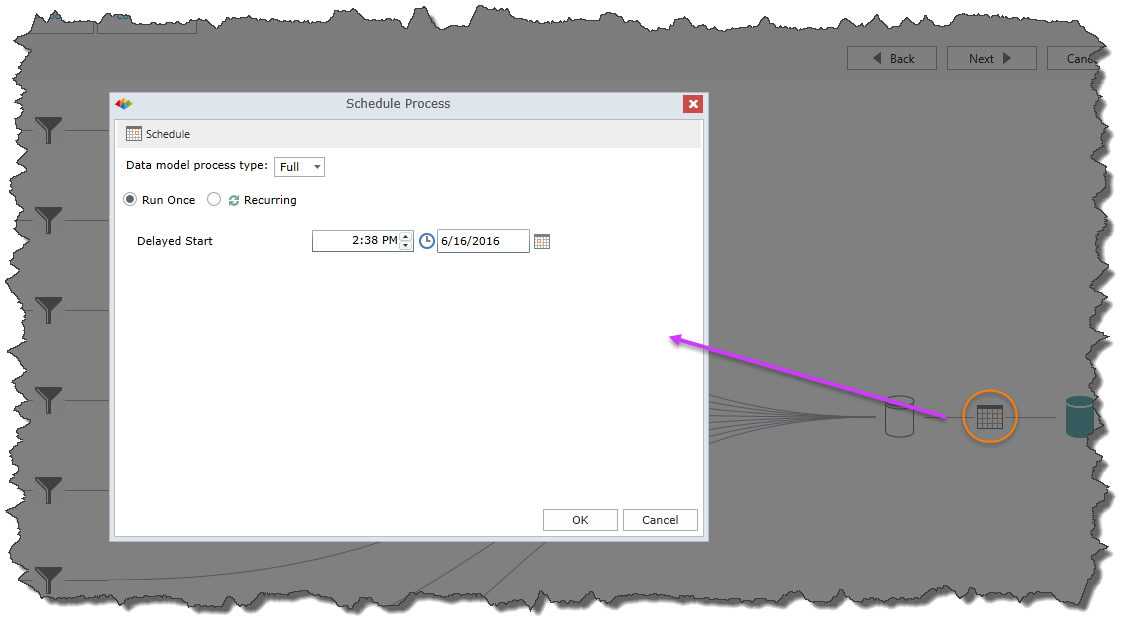
Scheduled Model Refresh
To automate the refresh of a model with new data ("hydration"), click the schedule button (orange highlight below) to view the scheduling dialog.
The scheduler is designed to operate in the identical fashion to the publication scheduling tool. Click here for more.
Home |
Table of Contents |
Index |
User Community
Pyramid Analytics © 2011-2022